
From The Raincoast Conservation Foundation and the Georgia Strait Alliance:
BACKGROUNDER
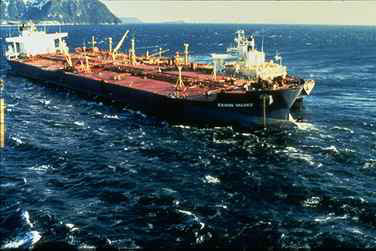
Kinder Morgan’s proposed Trans Mountain expansion will significantly increase oil tanker traffic through Vancouver harbour1 and the Salish Sea, from just 22 visits in 2005 to over 400 – see Table 1 below. Current plans indicate 408 tankers visits each year, increasing the Westridge terminal’s contribution to Port Metro Vancouver’s traffic from less than 3% to approximately 14%2. Even 408 tankers (816 transits) could still be an underestimate. Analysis by economist Robyn Allan3 indicates that potential future increases in pump capacity could bring the pipeline capacity to more than one million barrels per day, potentially requiring up to 475 tankers every year (950 transits). Additionally, previous Kinder Morgan investor presentations suggested the future use of significantly larger Suezmax tankers with a 350,000 barrel greater capacity than the 650,000 barrel Aframax tankers, now proposed. This significantly raises the potential spill volume and would require dredging of the 2nd narrows.
Table 1: Historic and projected crude oil tanker traffic, Port Metro Vancouver – Data from Kinder Morgan Presentation5. 2016b projection indicates potential increase with additional pumping capacity6. 2017 projected based on increased pipeline capacity7.
Current shipping traffic
 The recent West Coast Spill Response study8, commissioned by the BC Ministry of Environment, indicated that in 2012, 586 oil tankers of greater than 50,000 dry weight tonnes, crossed the passage line at Neah Bay at the entrance to the Strait of Juan de Fuca, out of a total of 11,137 vessel transits. With regard to Port Metro Vancouver, 116 tankers of greater than 50,000 dry weight tonnes crossed the passage line at Point Roberts, out of a total of 10,590 vessel transits.
In terms of the type of vessels, the Neah Bay passage sees a very high diversity of vessel types. The most common vessel types are: bulk cargo (27.5%), containerships (20.4%), and general cargo (14.2%). The largest number of tankers is accounted for at this passage line with about 1,100 transits per year. Most of these tankers are trading at the refineries near Cherry Point Washington and about 50% of them are over 50,000 DWT.
1 Kinder Morgan Canada – Investor presentation, March 2011. Available at:
http://www.kindermorgan.com/investor/presentations/2011_Analysts_Conf_05_KM_Canada.pdf
2 Trans Mountain project website: http://www.transmountain.com/tanker-traffic
3 Source, Robyn Allan, Online report, Accessed 18 July 2012. Available at: http://www.robynallan.com/wp- content/uploads/2012/05/Proposed-Pipelines-and-Tanker-Spill-Risk-for-BC-May-6-2012.pdf
4 Trans Mountain project website: http://www.transmountain.com/tanker-traffic
5 Kinder Morgan Canada – Investor presentation. Available at: http://www.kindermorgan.com/investor/presentations/2011_Analysts_Conf_05_KM_Canada.pdf
6 Source, Robyn Allan, Online report, Accessed 18 July 2012. Available at: http://www.robynallan.com/wp- content/uploads/2012/05/Proposed-Pipelines-and-Tanker-Spill-Risk-for-BC-May-6-2012.pdf
7 7 As of 10 January the Trans Mountain project website indicates up to 34 tanker visits per month by 2017. Trans Mountain website: http://www.transmountain.com/featured-stories/additional-customer-support-results-in-update-to-scope-of- proposed-expansion-project. Accessed 10 January 2013.
8 West Coast Spill Response Study, Nuka Research for BC Ministry of the Environment: http://www.env.gov.bc.ca/main/west- coast-spill-response-study/
|
Tanker traffic |
2005 |
2006 |
2007 |
2008 |
2009 |
2010 |
2016 a |
2016 b |
2017 |
|
Annual no. of crude oil tanker visits |
22 |
27 |
38 |
40 |
65 |
71 |
288 |
475 |
4084 |
The Point Roberts passage line is most often transited by tugs (25.5%), bulk cargo (23.9%), containerships (15.8%), and general cargo (12.5%).
Over the next 15 years, container ship volumes through the Salish Sea coastal waters are predicted to increase by 300 percent. The number of bulk cargo vessels over that time will grow by 25 percent and cruise ship traffic is expected to increase by at least 20 percent9. One single project, the proposed Roberts Bank Terminal 2 container terminal, would provide an additional 2.4 million container units10 – for comparison, in 2011 Port Metro Vancouver moved 2.5 million container units.
Increased vessel traffic and risk
US and Canadian oil spill experts recognize that predicted vessel traffic increases in the Salish Sea will increase the probability of an oil spill,11 and spill mitigation measures are no guarantee against the heightened risk that comes with vessel increases12. Risk analyses demonstrate that the likelihood of vessel collisions increases with traffic density13. Recent vessel traffic risk assessments14 specifically indicate the potential impact of three key proposals, the Pacific Gateway Terminal, Kinder Morgan’s Trans Mountain and the Delta Port expansion. Draft results indicate that relative to a 2010 base year these projects increase potential vessel traffic collision frequency and grounding frequency by 21% and 17% respectively. Potential collision cargo oil loss is increased by 97% and potential grounding cargo oil loss by 73%.
Accidents happen
Although the rate15 of large tanker spills and number of medium and large16 tanker related oil spills have decreased over the last few decades17, spills still occur. Responding to the Exxon Valdez event, a 1989 report to the BC Premier stated that if oil tankers operate off the BC coast, “it becomes a statistical question of when, not if, an accident is going to occur”.18 This point was underlined more recently by the B.C. Minister of Environment, then Barry Penner, who informed the Pacific States/British Columbia Oil Spill Task Force that, “given the high marine traffic and topography of our coastline, it simply is not possible to completely prevent spills from happening.”19
Accidents happen in the Salish Sea
9 Hall, 2008. State of the Ocean in the Pacific North Coast Integrated Management Area (PNCIMA). Available online: http://www.davidsuzuki.org/files/Oceans/State_PNCIMA_FINAL_ COPY.pdf. Accessed July 21, 2012.
10 Containers measured on twenty-foot equivalent unit (TEU)
11 The Stakeholder Workgroup Review of Planning and Response Capabilities for a Marine Oil Spill on the U.S./Canadian Transboundary Areas of the Pacific Coast Project Report, Sponsored by the Pacific States/British Columbia Oil Spill Task Force, April 2011. Available online: http://www.oilspilltaskforce.org/docs/notes_reports/Final_US_Canada_Transboundary_Project_Report.pdf. Accessed 15 July 2012.
12 Vessel traffic risk assessment (VTRA): Updating the 2005 VTRA GW/VTU MCS Simulation Model from VTOS 2005 data to VTOS 2010 data, April 2013. J.R. Vandorp and J. Merrick, Prepared for Makah tribe. Available online: http://www.seas.gwu.edu/~dorpjr/VTRA/Makah/Final%20Report/MAKAH%20Final%20Report%20041013.pdf.
13 Pacific States/British Columbia Oil Spill Task Force (OSTF), 2002). 2002 West coast offshore vessel traffic risk management project. Available online: http://www.oilspilltaskforce.org/ wcovtrm_report.htm. Accessed July 2 2012.
14 Dr J. R. Van Dorp, Dr J. R. W. Merrick, VTRA 2010, Synopsis of Scenario Comparison (Preliminary), The George Washington University, September 18, 2013.
15 Update of Occurrence Rates for Offshore Oil Spills, Cheryl McMahon Anderson, Melinda Mayes, and Robert LaBelle, June, 2012. US Department of Interior, Bureau of Ocean Energy Management and Bureau of Safety and Environmental enforcement. Figure 8 – Spill Rates by Year for Crude Oil Spills ≥1,000 bbl fromWorldwide Tankers and Tankers in U.S. Waters.
16 The International Tanker Owners Pollution Federation Limited (ITOPF), classisies medium spills as 7-700 tonnes and large spills as > 700 tonnes.
17 Oil Tanker Spill Statistics, 2011, International Tanker Owners Pollution Federation Limted (ITOPF). Accessed online 20 July 2012: http://www.itopf.com/information%2Dservices/publications/documents/STATSPACK2011.pdf
18 Anderson, D. (1989). Report to the Premier on oil transportation and oil spills. Victoria, B.C.: Queen’s Printer for British Columbia.
19 Penner, B. 2008. Speaking notes for address by Barry Penner, B.C. Minister of Environment, Annual General Meeting of the Pacific States/British Columbia Oil Spill Task Force held on September 18, 2008.
From the sinking of the Nestucca Barge disaster and the Westwood Annette oil spill in Howe Sound, accidents involving major marine vessels occur in and affect the Salish Sea in BC and Washington State.
Between 1999 and 2009, more than 1,200 vessel incidents20 were reported on the BC Coast, 12 involving tankers21. From 1995-2008, 14 oil spills from tankers in Washington State released 13,709 gallons of oil22. During the same period, 132 near-miss casualty incidents also occurred23. Had these incidents resulted in worst-case disasters, the amount of oil spilled would have been 2.7 billion gallons.24
Similarly the emergency tug at Neah Bay is not inactive. Between 1999 and 2010, the tug was deployed to assist forty-six vessels that were completely disabled or were suffering reduced maneuverability. In eleven incidents, the tug took vessels in tow to prevent then from drifting onto rocks and spilling oil25. These vessels had a combined spill potential of five million gallons of oil.
HMCS Winnipeg – The two tugs assisting the fishing trawler American Dynasty did not prevent it from colliding with the naval frigate HMCS Winnipeg at Esquimalt harbor on the 23 April 201326.
Tenyo Maru
On 22nd July 1991, Chinese freighter Tuo Hai collided with a Japanese fishing vessel, Tenyo Maru, 40 km (25 mi) northwest of Cape Flattery off the northern coast of Washington state close to the US – Canadian border. It sank releasing 354,800 gallons of intermediate fuel oil and 97,800 gallons of diesel27.
Hebei Lion – In November of 2009 the bulk carrier Hebei Lion dragged anchor in high winds overnight and was blown onto a rocky reef near Mayne Island in the Strait of Georgia28. Fortunately, the vessel was towed the next day without spilling oil but once again showing that modern vessels are in not immune to accidents.
MV Andre – Some anchorages in English Bay are already known to be susceptible to dragging in certain winds and although these are subject to seasonal restrictions the risk of unseasonably high winds is always present29. Where would the new anchorages go? The presence of these vessels also increases the potential for operational accidents. In July 2006 the MV Andre, a bulk carrier, spilled over 47 barrels of oil into Vancouver Harbour while bunkering fuel and anchorage. This serves as another example of
20 Here, a marine vessel incident refers to a vessel in distress (i.e. loss of engine power) vessel incidents can lead to marine vessel casualties – Source Reid, S. 2008, Major marine vessel casualty risk and response preparedness in British Columbia. Vancouver, B.C.: EnviroEmerg Consulting Services.
21 Shipping on the British Columbia Coast, Current Status, Projected Trends, Potential Casualties, and Our Ability to Respond: A Briefing Report, Living Oceans Society.
22 Oil Spill Risk in Industry Sectors Regulated by Washington State Department of Ecology Spills Program For Oil Spill Prevention and Preparedness, 2009, Environmental Research Consulting, prepared for Washington Department for Ecology.
23 Within US water of Washington State.
24 Oil Spill Risk in Industry Sectors Regulated by Washington State Department of Ecology Spills Program For Oil Spill Prevention and Preparedness, 2009, Environmental Research Consulting, prepared for Washington Department for Ecology.
25 State of Washington Department of Ecology web site, Accessed July 23. 2012. Web address: http://www.ecy.wa.gov/programs/spills/response_tug/tugresponsemainpage.htm
26 Transportation Safety Board internet site, accessed May 1 2013. Available online: http://www.tsb.gc.ca/eng/enquetes- investigations/marine/2013/m13w0057/m13w0057.asp
27 National Oceanographic and Atmospheric Administration web site, http://www.darrp.noaa.gov/northwest/tenyo/index.html. Accessed July 21, 2012.
28 State of Washington, Department of ecology, New Release, Accessed June 20, 2012. Available online: http://www.ecy.wa.gov/news/2009news/2009-273.html.
29 HARBOUR OPERATIONS MANUAL, Vancouver Fraser Port Authority, Updated – June 2010.
something very predictable, human error 30, the underlying cause of up to 80% of oil spills and marine accidents 31.
For more information contact:
Ross Dixon – Raincoast – ross@raincoast.org
Alexandra Woodsworth – Georgia Strait Alliance – alexandra@georgiastrait.org
30 Transport Canada, 2007. Ship Fined $80,000 for Polluting Vancouver Harbour. Internet article. Available online: http://www.tc.gc.ca/eng/media- room/releases-pac-2007-07-p005e-4235.htm. Accessed July 28 2012.
31 DeCola, E. & Fletcher, S., 2006. Assessment of the Role of Human Factors in Oil Spills from Vessels. Available online: http://www. pwsrcac.org/docs/d0028900.pdf. Accessed June 14 2012.
Posts on the Ecological Reserves website about the threat of Oil Spills from Tanker Traffic
Posts on the Race Rocks website about the Risk from Increased Tanker Traffic
Posts on the Ecological Reserves website about the threat of Oil Spills from Tanker Traffic
Posts on the Race Rocks website about the Risk from Increased Tanker Traffic