
by: Santiago Salinas
Candidate number: 0034 – 119
Subject: Biology Best Language Spanish
Student , Lester B. Pearson College of the Pacific
Submitted as partial fulfillment for the International Baccalaureate diploma program, January 2000
from the original: http://www.racerocks.com/racerock/research/santiago/santiago.htm

Anthopleura elegantissima , photo by Santiago Salinas
As with any other species at Race Rocks, Anthopleura elegantissima is an important member of the ecosystem to which it belongs. By knowing its ecological niche, trends can be analyzed, niche overlapping or other predictions may be made, particularly, for example, if new species are introduced.
?Since the statistical device suggested that the three populations are organized in the same way, a general description of the ecological niche was given. The species prefer a temperature range of 11-13ƒ C, the ideal elevation span goes from 1.5 to 2.8 meters, thus, it is an inter tidal species, and finally, the preferable time underwater was found to be 5 to 15 hours.
_________________________Table of Contents
Introduction
The Problem ………………………………………………………..?………….9 ?
Purpose and Background of the Study …………………………………………9
Hypothesis ………………………………………………………………….…..9
Assumptions ………………………………………………………………..…..10
Limitations ………………………………………………………………….….10
Definition of Terms ……………………………………………………………11
Review of Literature and Related Research
Introduction, Information about the Organism ………………………………..13
The Theory …………………………………………………………………….15
Research Results in Related Areas ……………………………………………16
Research Design and Procedures
The Setting and Population of the Study ………………………………………18
Field Work ……………………………………………………………………..19
?Instruments Used ………………………………………………………………21
?Statistical Techniques Used ……………………………………………………22
Analysis of Data
Introduction …………………………………………………………………………………23
Findings …………………………………………………………………………23
Conclusions and Recommendations for Further Study
Interpretation and Implications of the Findings ………………………………………….…40
Recommendations ……………………………………………………………….42
Appendix
Bibliography
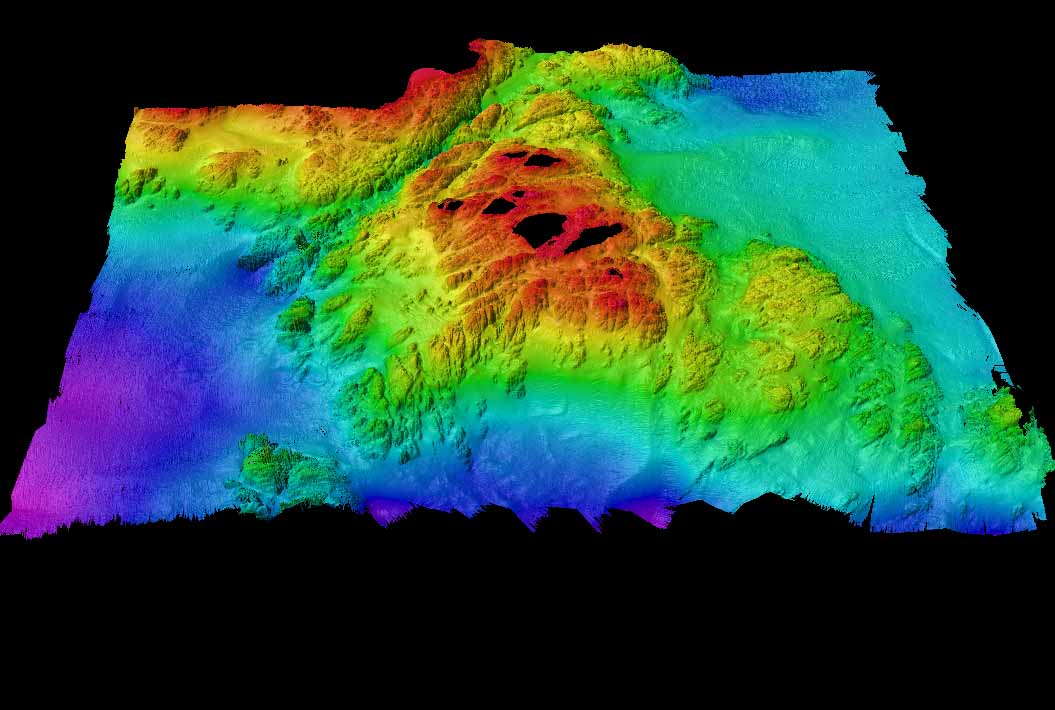
Figure 1. Topographic representation of Race Rocks …………………………………………………….…….12
Figure 2. Representation of Anthopleura elegantissima and Anthopleura xanthogrammica …………………….14
Figure 3. Location of Populations at Race Rocks ……………………………………………………18
Figure 4. Tidal Height graph ………………………………………………………………………. …23
Figure 5. Terrain Gradient graph (Population 1) ………………………………………………………25
Figure 6. Abundance graph (Population 1) …………………………………………………………..26
Figure 7. Elevation against # of Organisms graph (Population 1) ………………………………..27
Figure 8. % of Organisms at different Temperatures graph (Population 1) ……………………..28
Figure 9. Terrain Gradient graph (Population 2) ……………………………………………………30
Figure 10. Abundance graph (Population 2) …………………………………………………………31
Figure 11. Elevation against # of Organisms graph (Population 2) ………………………………32
Figure 12. % of Organisms at different Temperatures graph (Population 2) ……………………33
Figure 13. Terrain Gradient graph (Population 3) ………………………………………………….35
Figure 14. Abundance graph (Population 3) …………………………………………………………36
Figure 15. Elevation against # of Organisms graph (Population 3) ………………………………37
Figure 16. % of Organisms at different Temperatures graph (Population 3) ……………………38
Figure 17. Elevation, Temperature and # of Organisms graph (Population 1) …………………40
?Figure 18. Elevation, Temperature and # of Organisms graph (Population 2) …………………41
Figure 19. Elevation, Temperature and # of Organisms graph (Population 3) ………………….42
Tables
Table 1. Data Collection for Population 1 ……………………………………………………………24
Table 2. Data Collection for Population 2 ……………………………………………………………29
Table 3. Data Collection for Population 3………………………………………………………34
?Finally, I would like to thank all the organisms at Race Rocks, especially Anthopleura elegantissima, for their patience and understanding of my investigations and for not complaining from my sometimes careless techniques.
The Problem: Anthopleura elegantissima (common name: aggregating anemone) plays, along with all other biotic and abiotic components, an important role in the ecosystem to which it belongs. It is a highly valuable member of many food webs and participates in symbiotic relationships with other species. Taking this information into account, it would be useful to know facts about A. elegantissima in order to be able to predict and analyze trends in the ecosystem so as to gain an insightful knowledge about the species and its relation to the ecosystem found at Race Rocks.
Purpose and Background of the Study: To achieve the goals presented, a wide range of proposals were identified, leading to the decision to investigate the ecological niche as a focused and clear plan. The final design involved testing three populations at different locations of the island with the purpose of determining the preferred range of abiotic conditions for A. elegantissima. Four very significant variables were examined, all of them intimately related with intertidal zonation. These four variables were: the slope of the gradient, the tidal height, the time covered by sea water and the rock temperature. Carrying out the field work in three different sites allowed room for generalized conclusions about the species to be made.
Hypothesis: A null hypothesis for the Mann-Whitney test was formulated: “the three different locations are not inter-related and the similarities that may occur are merely coincidental.” If rejected, some conjectures about the species had to be formed. Given that Anthopleura elegantissima is a low inter tidal species, its range of positioning would not be between 1 to 3 meters. A hypothesis was made based on the fact that sea water is generally at about 10ƒ C, thus the rock temperature was not expected to be similar to this.
Assumptions: One of the major assumptions made was that the tide tables for Victoria, British Columbia, Canada are the same as these for Race Rocks. In theory this may not be true since Race Rocks is located approximately 6 km. away from Victoria. Therefore, there might exist a slight difference in tidal heights between the two zones.
Limitations: The entire experiment and data collection was done on the 27th of October, 1999, due to the limiting factor of relative low tides occurring in day-light hours. Hence the experiment could not be repeated on another day. Therefore, the research reveals the ecological niche of Anthopleura elegantissima at a fixed point in time and not the variations or changes in its distribution over a period of time. Furthermore, based on these results, the general ecological niche of the species cannot be concluded since all the data was gathered in a specific place, Race Rocks, which is a distinct site due to its location.
Another major limitation is that the “ecological niche” is an abstract term and therefore, the ecological niche of a species can never be fully represented. What was done in this case was to narrow the aspects to be considered and try to work with them by relating each factor to the others to acquire an approximation of the ecological niche. In this essay, four abiotic components were measured in order to obtain an insight to the ecological niche of Anthopleura elegantissima.
Definition of Terms: A number of terms should be defined at this point in order to ensure a clear understanding of this essay. One of these terms is population, which is defined as: all members of a species living in a particular area and making up one breeding group (Kucera, 1978). This is of particular importance since a similar species, Anthopleura xanthogrammica, may be found on the island, a phenomenon which would cause some distortions in the results if they are counted as Anthopleura elegantissima. Tides – the gravitational effects of the sun and moon on the oceans of the earth – are also a fundamental pivot in intertidal life. Tides along the Pacific coast of North America are of the mixed semidiurnal type; that is, there is a pronounced difference between the levels to which two successive low tides fall, and a lesser, but still apparent, difference between the levels reached by two successive high tides (Carefoot, 1977). Lastly, the most important term to be defined is ecological niche. The niche of a population or species is its functional role in an ecosystem. Using a human analogy, the niche is the species’ profession or way of life whereas the habitat is where this way of life is carried on — its address. The way a population responds to the various characteristics of its habitat is part of this population’s way of life and, therefore, of its niche. Hutchinson was the first to formally quantify the niche concept in terms of geometric space. The level of activity describes the ability of the individual to exploit the resources in a given level of each environmental factor (Odum, 1963). Then the niche space occupied by the species is the 3-dimensional space actually occupied by all individuals (Rickleffs, 1996). An empirical model (Box and Draper, 1989) can be obtained by the empirical determination of niche occupancy (number of individuals, in this case) in terms of n environmental variables (slope, tidal height, time covered and rock temperature).
Introduction, Information about the Organism: The field work was conducted at Race Rocks, Southern Vancouver Island, British Columbia, Canada. This area was chosen for ecological reserve status because of its unique richness and diversity of marine life. Race Rocks is ideally located to receive a constant supply of plankton swept past by almost continuous strong currents (up to 7 knots) . This provides nourishment for a complex group of underwater organisms.
One of the many organisms found at Race Rocks are sea anemones. Sea anemones belong to the phylum known as the Cnidaria, from the cnida or stinging cells that are present in this major group of animals that also include corals, jellyfish, hydroids, medusae, and sea fans. Sea anemones, corals and their allies form the class know as the Anthozoa. Anthopleura elegantissima (Phylum Cnidaria, Class Anthozoa, Subclass Zoantharia, Order Actiniatia, Family Actiniidae) is abundant on rock faces or boulders, in tide pools or crevices, on wharf pilings, singly or in dense aggregations (Smith and Carlton, 1975). It is a species characteristic of middle intertidal zone of semi protected rocky shores of both bays and outer coast from Alaska to Baja California. Aggregating individuals do not exceed 6 centimeters in column diameter and 8 centimeters across the tentacular crown. The column is light green to white, and twice as long as wide when extended, with longitudinal rows of adhesive tubercles (verrucae) often bearing attached debris (Carefoot, 1977). The species presents numerous short tentacles, in five or more cycles, which are variously colored. Anthopleura elegantissima reproduces both sexually and asexually. In sexual reproduction, ova are present as early as February and grow steadily until their release in July; the ovarian is then resorbed and new eggs do not appear until the following February. Sperm are released through the summer. The asexual reproduction occurs by longitudinal fission. This process results in aggregations or clones of anemones pressed together in concentrations of several hundred per square meter. Anthopleura elegantissima feeds on copepods, isopods, amphipods, and other small animals that contact the tentacles. On the other hand, it is preyed upon by the nudibranch Aeolidia papillosa, which usually attacks the column, by the nail Epitonium tinctum, which attacks the tips of the tentacles, and by sea stars such as Dermasterias imbricata that can engulf an entire small anemone. Moreover, in some anemones, small pink amphipods, Allogaussia recondita, make a home in the gastro vascular cavity (Carefoot, 1977).
The theory: In 1957, G. E. Hutchinson defined the niche concept formally. One could describe the activity range along every dimension of the environment. Physical and chemical factors such as temperature, humidity, salinity, and oxygen concentration, as well as biological factors such as prey species and resting background against which an individual may escape of predators, could be determined. Each of these dimensions could be thought of as one of the n-dimensions in space. Visualizing a space with more than three dimensions is difficult, thus the concept of the n-dimensional niche is an abstraction. We may, however, deal with multi-dimensional concepts mathematically and statistically, depicting their essence by physical or graphical representations in three or fewer dimensions. Moreover, Ricklefs notes that “… for example, a graph relating biological activity to a single environmental gradient represents the distribution of a species’ activity along one niche dimension. The level of activity, whether oxygen metabolism as a function of temperature or consumption rate as function of prey size, conveys the ability of an individual to exploit resources in a particular part of the niche space and, conversely, the degree to which the environment can support the population of that species. In two dimensions the individuals niche may be depicted as a hill with contours representing the various levels of biological activity. In three dimensions, we must think of a cloud in space whose density conveys niche utilization. Beyond three the mind boggles.”
To be more precise, it should be recognized that there are three different definitions for the term niche. The first one (also known as “niche as community function”) comes from Elton (1927) defining it as the animal’s place in the biotic environment, its relation to food and enemies. The second definition is called “niche in the species” and reveals that a specific set of capabilities for extracting resources, for surviving hazard, and for competing, coupled with a corresponding set of needs (Colinvaux, 1982). The most used and known is the one defined by Hutchinson, which was explained previously
Research Results in Related Areas: Even though only one research paper was found containing information about Anthopleura elegantissima at Race Rocks, many investigations have been carried out with Anthopleura elegantissima and its physiology. The paper obtained on Anthopleura elegantissima at Race Rocks (Zahid, 1987) tries to detail the distribution of the species in one crack by two statistical methods (Plotless and Poisson techniques). It is concluded that A. elegantissima is an intertidal organism showing a clumped distribution. The clonal form, being lower mid-intertidal is exposed to sunlight and air much more than the solitary form in the sub-tidal zone. Hence, the clumped distribution is very useful and is also an important factor in reducing desiccation and water loss, as clumping reduces the surface area exposed to light.
The Setting and Population of the Study: The field work was designed to take place in three different locations of Race Rocks (see Figure 4), in order to gain a more detailed examination of the ecological niche of Anthopleura elegantissima in this island. Another reason for doing so was well explained by Odum: “It is also true that the same species may function differently —that is, occupy different niches- in different habitats or geographical regions.” The three places exhibit different environmental conditions and, therefore, the species may experience changes in its distribution. These changes could be current flow (which is in and of itself a major contributor to tidal life), light exposure, and even different rock composition.
A hazardous inconvenience that had to be overcome before doing the field work was to be able to distinguish among the two major types of sea anemones at Race Rocks, Anthopleura elegantissima and Anthopleura xanthogrammica. In order to achieve this, a key book was consulted. In the book, the distinctive characteristics between the two are described (see Appendix.)
Field Work: The complete field work took place on the 27th of October, 1999 due to the limiting factor of low tide level. The priorities were the elevation of the terrain and the number of organisms per quadrat in view of the fact that the tidal level was constantly altering, making the measurements inaccurate otherwise. The rock temperature was taken once these two sets of values had been gathered from the three locations. For the sake of help, a line transect was set in each crack to make the data collection uncomplicated and feasible.
Elevation: With the aim of measuring the elevation of the terrain for each population, a rudimentary, home-made apparatus was created. Due to the fact that the topography of the shore is extremely irregular at Race Rocks, it is not possible to assume that the elevation is a straight line. Thus, to have a detailed insight of Anthopleura elegantissima —or any other intertidal organism- at Race Rocks, an imperative factor to be considered is elevation. To approach this, the first action taken was to delimit the transect (generally a straight line along which observations are made in a systematic fashion) and the quadrats (starting from where the tidal level equals 0 meter). Since there was not a zero meter tide predicted, it was decided to start at 0945 approximately —tidal height equal to 2- and calculate the zero tide level. To accomplish the task, a two meter stick was used perpendicular to the sea water since tidal height is a vertical measure of water. Following this, a 4 meter stick was put where the tidal level equals 0 meter -quadrat number 15- (perpendicular to the sea water) and, with the help of a rope, a triangle was formed between the stick, the rope and the last quadrat —number 1. Once the triangle was finished, the elevation existing between quadrat number 1 and number 15 is known by the distance in the stick from the land to the conjuncture of it and the rope (for example, 3.9 in the first population). The subsequent measurements were much easier to carry since only a meter stick and a measuring tape were needed. Starting from quadrat number 1, a meter was measured with the measuring tape along the land. Then, the meter stick was put in such a manner that it formed a 90ƒ angle with the top of the quadrat, giving a number (0.3 in the first population). Therefore, 3.1 minus 0.3 equals 2.6, the elevation for quadrat number 2). So on and so forth the procedure was repeated until quadrat number 15 was reached.
Number of organisms: A very important feature involving the number of organisms per quadrat is the quadrat’s size. It was proven by Grey-Smith (1952) that the size of a quadrat could actually determine some erroneous conclusions in a population by using a series of progressively larger quadrats to measure the distribution in an artificial situation in which individuals were represented by colored disks. A reasonably good size for the quadrats was estimated to be 0.5 by 0.5 meters, given personal observation. Once the quadrats were sorted out, the counting took place. Only if more than 75 % of the organism was inside the quadrat was it counted. A difficult aspect of the counting was to differentiate individuals from the same group clone or aggregation. This difficulty was expected since the clones are held together very tightly and because at this time of the year young anemones are developing their bodies (as fertilization occurs during summer).
Rock temperature: This process was relatively simple compared to the previous two. It consisted of using the thermometer in small crevices in rocks —for each quadrat- in order to get the rock temperature.
?Time underwater: Aided by the tide table for the day (starting at 0500 and finishing at 2300), it is possible to calculate how much time a certain elevation is exposed to sea water. Assume that it is desirable to know the underwater time of a quadrat at 2.5. Then, we trace a line at 2.5 and the area under the curve will indicate the time that quadrat was covered by water.
Instruments Used: A simple technological apparatus was used for the field work. A measuring tape, a meter stick, a four meter stick, the tide tables for Victoria, BC, a thermometer, and a rope were all the required instruments.
Statistical Techniques Used: The technique used to verify that the distribution of the species was not random or by chance was the Mann-Whitney test. This non-parametric tool (meaning there are no specific distributional assumptions required) is sometimes called Wilcoxon test or rank sum test. This test relies on a special kind of transformation that replaces each observation by its rank in the combined sample. The purpose of this is to transform the data to a scale that eliminates the importance of the population distribution altogether (Ramsey and Schafer, 1997). In order to make it easier and more accurate, a web-page (VassarStats) was utilized to perform the calculations and the statistics values.
Introduction: The data will be presented by population and not by factor. This is aimed to help the understanding of the ecological niche of Anthopleura elegantissima at Race Rocks in a detailed and comprehensible fashion. Three separate populations were examined on different parts of the island The populations are numbered (1, 2 and 3) referring to a certain strip (see Figure 4.)
Findings: The Mann-Whitney test was used to determine whether or not there is a general trend between the three populations. Two populations were tested at a time, therefore, three runs of the test were conducted using the number of organisms as the variable to be ranked. Using VassarStats, an U value was calculated: 140.5 for populations 1 and 2, 96.5 for populations 1 and 3, and 44 for populations 2 and 3. These U values were then checked in the significance levels table:
By this, it is possible to conclude that, although it is impossible to be absolutely certain that the different is not due to chance, the probability is sufficiently small for it to be considered negligible. Thus, the null hypothesis can be rejected and assume that there are similarities among the three populations. Bearing that in mind, the variables should now be tested to determine the ecological niche of Anthopleura elegantissima at Race Rocks.
?Tidal Height:
The variations of the tidal height of the day are normal and reflect the constant water movement that take place in the ocean affecting inter tidal life. Based on this chart, the underwater time will be calculated. Note that the chart begins at 0500 and ends at 2300 (therefore, total time underwater = 18:00).
Population # 1:
 Table 1.
The terrain gradient for population number 1 is the typical slope and is also the most regular among the three. It has a steep drop at the end (quadrat # 15) where it meets the sea water at 0 m. (tidal level). This gradient features some small tide pools and is sometimes covered by kelp beds. By personal observations, I could say that it is the strip with the highest level of species diversity on it.
Even though this is not the most abundant population (432 individuals), it features the largest number of individuals per quadrat (76) and has an extremely large number of Anthopleura elegantissima at a certain level of the gradient. It should also be noted that no individuals were found in the first three quadrats and there were not many before quadrat 6. The number of organisms was measured in quadrats of 0.25 square meters.
This graph clearly shows the relationship between elevation and number of organisms. It is easy to recognize that the preferred place for Anthopleura elegantissima is around 1.2 to 2.5 meters, a fact that will be very useful when making conjectures about its niche. The drop of abundance at 2.1 is only a local anomaly. At high heights (3.9, 3.6, etc.) there were no organisms present while at low heights there were some (however not very many).
Despite the fact that a correlation could not be found between rock temperature and elevation or tidal height, an important feature was discovered, this being the relationship involving surface rock temperature and abundance. It was discovered that Anthopleura elegantissima prefers a rock temperature of 11, 12 or 13 because of the fact that these were the only temperatures found on the rocks (higher elevations were found to be warmer and A. elegantissima apparently does not favor such conditions).
Population # 2:
This gradient features a large tide pool at 1.25 meters level. In it, a whole new ecosystem is found due to different climatic conditions, therefore, it may create some distortions with the number of Anthopleura elegantissima expected. A steep fall at the end should also be noted as a probable cause for the distribution of the species.
In this population some irregularities are shown. Quadrats 6 and 13, for example, are not quite as expected. The virtual absence of organisms in quadrat 1 and 2 has to be considered as well. Overall, an inverted u-shaped curve could be distinguished.

Again, the same trend as in population 1 is presented. A major distribution is seen at 2.1 to 2.8 meters and none or very few organisms were found at high elevations. On the other hand, a large number of the species was encountered at very low elevations.
These results reinforce the idea that Anthopleura elegantissima prefer a range of temperatures of 11-13ƒ C. No further analysis could be made since it is unlikely that a distinction could be drawn using greater detail such as degree by degree. On the other hand, at temperatures significantly different from the range above, the species will not be found.
Population # 3:
This gradient was the most irregular of the three, featuring ups and downs from the first to the last quadrat. A fact that seems rather curious is that on top of this strip sea lions lie down to rest quite frequently whereas this does not happen in the other two strips, probably because this gradient starts from a very plain, big rock. Kelp beds are observed floating on water and algae is seen at higher elevations.
 Figure 14.
Although this graph does not show a perfect inverted u form, a general trend is seen. This population is the less abundant of the three and shows some irregularities in the middle quadrats.
Apparently, more organisms prefer a range of 2.9 to 2.2 meters in this gradient. Some animals were found at 0.0 meters but not many were seen at higher heights. Two major drops, at 2.2 and 1.8 meters, can be explained due to overpopulation of other species in those two tide pools.

Once again, no other temperature ranges were found, leading to the conclusion that Anthopleura elegantissima does prefer temperatures of 11 to 13ƒ C.
Interpretation and Implications of the Findings: After looking at the graphs, general descriptions of the ecological niche of A. elegantissima could be made:
![]() ?The ideal temperature for the species is a range of 11-13ƒ C because at higher or lower temperatures, the number of organisms decrease significantly. The null hypothesis is then rejected.
?The ideal temperature for the species is a range of 11-13ƒ C because at higher or lower temperatures, the number of organisms decrease significantly. The null hypothesis is then rejected.
![]() ? Idyllic elevation goes from 1.5 to 2.8 meters. Once again, the null hypothesis is rejected.
? Idyllic elevation goes from 1.5 to 2.8 meters. Once again, the null hypothesis is rejected.
![]() ? Since time underwater is a function of elevation, it was not considered on graphs. However, the preferable time underwater for Anthopleura elegantissima was found to be 5 to 15 hours approximately (out of 18 hs.)
? Since time underwater is a function of elevation, it was not considered on graphs. However, the preferable time underwater for Anthopleura elegantissima was found to be 5 to 15 hours approximately (out of 18 hs.)
A clear description of the ecological niche dimensions is observed in the graphs below. The larger bubbles represent the portion of the space that the species prefers:
 Figure 17
Recommendations: If a thorough understanding of the ecological niche of Anthopleura elegantissima is desired, these and more variables should be tested to obtain a more profound and detailed approximation. Also, by determining ecological niches of other species such as Anthopleura xanthogrammica and comparing them, it is possible to predict niche overlapping, which is very likely to lead to a constant competition and aggressive behavior of the species. Moreover, it could be used to predict changes in the ecosystem if introduced species are brought. The documentation of data like this provides an invaluable record for establishing baseline distributions of organisms. Scientists are often required to monitor anthropogenic changes in sensitive marine environments. Similar niche patterns could be done on the other key invertebrates of the inter tidal and sub-tidal zone at Race Rocks, for example black leather chitons, limpets, abalone and various species of algae.
“Column green to white; tubercles usually in distinct longitudinal rows; tentacles with pink tips; height up to about 5 cm; often in aggregating masses, and frequently buried by sand covering rocks to which they are attached ‡ Anthopleura elegantissima. ~~ Column green or olive green; tubercles usually not in distinct longitudinal rows; tentacles uniform in color and not pink-tipped; height regularly exceeding 5 cm; solitary and not often buried in sand ‡ Anthopleura xanthogrammica.”
![]() ?Buschsbaum, R., Buschsbaum, M., Pearse, J, and Pearse, V. 1987. “Animals without backbones.” University of Chicago Press, Chicago, Illinois.
?Buschsbaum, R., Buschsbaum, M., Pearse, J, and Pearse, V. 1987. “Animals without backbones.” University of Chicago Press, Chicago, Illinois.
![]() ?Carefoot, T. 1977. “Pacific seashores.” J.J. Douglas, Vancouver, BC, Canada.?
?Carefoot, T. 1977. “Pacific seashores.” J.J. Douglas, Vancouver, BC, Canada.?
![]() ?Colinvaux, P. 1986. “Ecology.” John Wiley & Sons, United States of America.
?Colinvaux, P. 1986. “Ecology.” John Wiley & Sons, United States of America.
![]() ?Francis, L. 1973. “Clone specific segregation in the sea anemone Anthopleura elegantissima.” Biological bulletin. 144, 64-72.
?Francis, L. 1973. “Clone specific segregation in the sea anemone Anthopleura elegantissima.” Biological bulletin. 144, 64-72.
![]() ?Francis, L. 1973. “Intraspecific and its effects on the distribution of Anthopleura elegantissima and some related sea anemones.” Biological bulletin. 144, 73-92.
?Francis, L. 1973. “Intraspecific and its effects on the distribution of Anthopleura elegantissima and some related sea anemones.” Biological bulletin. 144, 73-92.
![]() ?Kozloff, E.N. 1974. “Keys to marine invertebrates of Puget Sound, the San Juan Archipelago, and adjacent regions.” University of Washington Press, Washington State.
?Kozloff, E.N. 1974. “Keys to marine invertebrates of Puget Sound, the San Juan Archipelago, and adjacent regions.” University of Washington Press, Washington State.
![]() ?Kozloff, E.N. 1993. “Seashore life of the Northern Pacific Coast.” University of Washington Press, Seattle, Washington State.
?Kozloff, E.N. 1993. “Seashore life of the Northern Pacific Coast.” University of Washington Press, Seattle, Washington State.
![]() ?Kucera, C. L. 1978. “The challenge of ecology.” The C. V. Mosby Company, Saint Louis.
?Kucera, C. L. 1978. “The challenge of ecology.” The C. V. Mosby Company, Saint Louis.
![]() ?Lewis, J.P. 1995. “La biosfera y sus ecosistemas: una introducción a la ecología.” Ecosur, Rosario, Argentina.
?Lewis, J.P. 1995. “La biosfera y sus ecosistemas: una introducción a la ecología.” Ecosur, Rosario, Argentina.
![]() ?Odum, E. P. 1963. “Ecology.” Holt, Rinehart and Winston, United State of America.
?Odum, E. P. 1963. “Ecology.” Holt, Rinehart and Winston, United State of America.
![]() ?Odum, E.P. 1989. “Ecology and our endangered life-support systems.” Sinauer, Sunderland, Massachusetts.
?Odum, E.P. 1989. “Ecology and our endangered life-support systems.” Sinauer, Sunderland, Massachusetts.
![]() ?Pianka, E. R. 1986. “Ecology and natural history of desert lizards.” Princeton University Press, Princeton, NJ.
?Pianka, E. R. 1986. “Ecology and natural history of desert lizards.” Princeton University Press, Princeton, NJ.
![]() ?Smith, R.I., and Carlton, J.T. 1975. “Intertidal invertebrates of the Central California Coast.” University of California Press, Los Angeles, California.
?Smith, R.I., and Carlton, J.T. 1975. “Intertidal invertebrates of the Central California Coast.” University of California Press, Los Angeles, California.
![]() Zahid, M. 1987. “Distribution of Anthopleura elegantissima.” Extended Essay for the International Baccalaureate.
Zahid, M. 1987. “Distribution of Anthopleura elegantissima.” Extended Essay for the International Baccalaureate.