
News/Reports
Protected Areas, Climate Change & The Path Forward
By Tory Stevens, with assistance from Doug Biffard and Trevor Murdock Speaking notes transcribed by Mike Fenger with permission (Photos by Bill Munt, Gail Ross, Boomer Jerritt, Greg Betz & BC Parks)
From: THE LOG FRIENDS OF ECOLOGICAL RESERVES NEWSLETTER
SPRING/SUMMER 2010
Introduction
This is a summary of a public presentation organized by Friends of Ecological Reserves for the 2010 Annual General meeting. The speaking notes were provided to FER by Tory and edited by Mike Fenger to form this LOG article. Only a few of the many graphics were included in the article but the powerpoint presentation appears on the FER web site (www.ecoreserves.bc.ca).
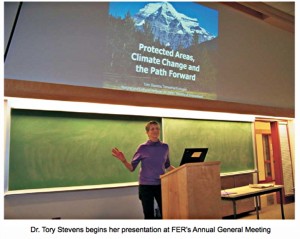 R ecently, I , (Tory Stevens) read a few reports that bemoan the loss of focus on biodiversity because of our obsession with climate change. As an ecologist for a protected areas system, I see the problems as essentially one and the same. The reason why we are so concerned with climate change is because of its affect on biodiversity and facilities and agriculture and water. A couple of examples to begin with of actual data (or proxies) of global climate to illustrate that the climate changes are real. These examples show the benefits that we gain from monitoring data.
The outline of the presenta- tion begins with a global con- text, then some of the recorded effects of climate change on species and processes in BC. This is followed by a short history of the current protected areas system and finally a discus- sion of the path forward from the provincial parks perspective.
The last section deals with how the protected areas system can effectively contribute to the conservation of biodiversity in this new era of climate change and from the point of view of protected area managers; what can Park managers do in their area to adapt to climate change?
Climate Change Monitoring Information
Because of climate records (monitoring) it is possible to look back 160 years to the beginning of the industrial revolution in 1850 and review the changes in global air temperature. The data over the last 160 years shows a strong trend and a sharp increase since the mid 1950s. To provide a
point of reference a 30-year average from 1960 to 1990 shows that all but two years since 1980 are above this average (www.cru.uea.ac.uk/cru/info/war ming/).
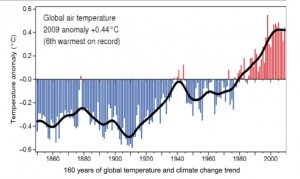 This 160 years of climate records when put into a global perspective extending back over the last millennium includes a lot of variability such as the period between 1600 and 1850 known as the “little ice age”. Global climate reconstruction before climate records is based on ice cores, tree rings and other proxies. The data shows, even by conservative measures, that we are leaving a millennium- long period of relative stability.Closer to home in BC, it is useful to look at provincial temperature records. To illustrate change in BC, it is helpful to consider the rates of changes of minimum temperatures between 1970 and 2000. Records show the north is changing faster than the south and the coast is chang- ing the slowest (but it is still changing). It is important when thinking about ecosystems and species, however, to understand the difference between absolute rate of change and relative rate of change. In Victoria there is very little variability (7 degrees in February for instance) but in Quesnel for the same month, there is 17 degrees of variability. We understand species in the Quesnel climate can tolerate greater extremes than an organ- ism on southern Vancouver Island. So while the absolute temperature change in Victoria is smaller than Quesnel, relative to the range of variability it is much larger. The conclusion is that just because coastal regions have lower overall average changes in temperature, this does not necessarily mean species on the coast are less vulnerable. Coastal species are experiencing changes outside their accustomed range.
Along with increased temperature (especially temperature minimums in winter), other environmental variables have measured changes such as: precipitation (regional varia- tion), decreased snow pack, earlier spring runoff and ice break-up, warmer river temper- atures, change in plant phenology such as earlier flowering or bud break, changes in the timing of migrations,more intense insect outbreaks and longer fire seasons. The fire season has been more intense as a result of drought and higher temperatures. This translates into greater area burned. There is a significant amount of infor- mation already available to tell us that there are changes under- way. Where we have monitoring information there is evidence of change.
These variables affect species as individuals respond to changes in their environments. Species have always been moving. Communities are always changing. Climate change favours species that are small (efficient), fecund (reproduce quickly), and plastic (flexible in their life requisite needs). We can expect major changes will occur when thresholds are crossed.
This focus on climate change has been good for the conserva- tion community in that there is now greater understanding about the importance of protected area design and links to evolutionary processes. In the absence of climate change and
solely due to the magnitude of human disturbances to land- scapes, what we see now was going to happen to species and ecosystems anyway. Climate change has simply accelerated our progress down this road and it is now apparent to others outside the conservation com- munity that BC’s biodiversity is on a perilous trajectory.
Examples of Species Responses to Climates
Biological changes have already occurred in BC. To illustrate, here are some exam- ples of responses of insects, birds, fish, trees, marine plants and sea birds that have already shifted in response to climate change. Species are already responding to change. All we need to do is monitor to under- stand what they are signalling.
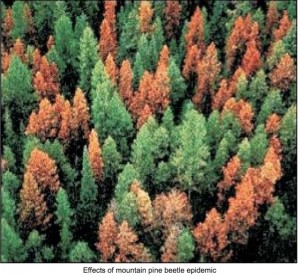 What does small, fecund and plastic make you think of? The mountain pine beetle epidemic is the most obvious and so far the most costly result of climate change in BC. Mountain pine beetle is a native species that has probably been present in BC’s forests as long as pine trees. The current epidemic stems in part from the lack of suitably low temperatures in the winter to kill a significant number of over- wintering larvae. A threshold was passed that has resulted in the increase in the range of the beetle. By 2006, effects of climate change had expanded suitable mountain pine beetle habitat by 75 percent.
There are observable changes apparent in yellow cedar forests, too. The leading hypothesis for yellow cedar die-offs on the north coast of BC and Alaska are a result of less snow cover in the spring. Since yellow cedar roots are susceptible to freezing and no longer protected by late snow pack, mature trees are dying. Dead yellow cedar stands are most easily identified in areas with a high component of yellow cedar (above 300 m elevation), but low enough in elevation to be subject to the effects of low snow pack (below 400 m) (Hennon, P. E., D.V. D’Amore, S. Zeglen and M. Grainger, 2005. Yellow-cedar decline in the north coast forest district of BC. USDA Forest Service. PNW Research Station. Research Note PNW-RN-549).
Bunnell, Squires and others, analyzed bird species records available with data going back more than 100 years (Bunnell, F. K. Squires, M. Preston and W. Campbell, 2007 “Towards a general model of avian response to climate change in implications of climate change in BC’s southern interior forests”. Workshop, April 26-27, 2005, Revelstoke, BC, Columbia Mountains Institute of Applied Ecology. Pp. 59-70). The researchers chose to review records of eight bird species over the last century. Birds with different life history strategies such as: residents, short distance migrants, long distance migrants, etc. were chosen. They hypothesized that if they could establish patterns in the response of birds with similar life histories, it would be possi- ble to predict the behavior of other species with these same life history patterns. The com- mon loon was used as an exam- ple of a partial migrant. It migrates between the coast and the interior of BC. Over the last century it has changed its coastal departure date and now arrives 2.5 months earlier. The com- mon loon appears to have picked up clues from the envi- ronment and adapted.
In addition to the changes in behaviour of resident bird species there are 25 birds found in BC in 2006 that were not on the original list of birds for the province put together by Ian McTaggert Cown in 1947 (Quayle, J.F., L.R.Ramsay and D.F. Fraser. 2007. Trend in the Status of Breeding Bird Fauna in British Columbia, Canada, Based on the IUCN Red List Index Method. Conservation Biology 21(5) 1241-1247.) Climate changes are drying habitats to the south and creat- ing warmer winters in the north. The new species may also be those well adapted to human modified landscapes. The new species in BC today are: yellow rail, northern fulmar, Forster’s tern, Brandt’s cormorant, American avocet, canyon wren,broad-winged hawk, gray flycatcher, California gull, Caspian tern, green heron, white-throated swift, black- chinned hummingbird, ring- billed gull, blue jay, Anna’s hummingbird, Baltimore oriole, rose-breasted grosbeak, American pipit, white-winged crossbill, boreal chickadee, and common grackle
The sockeye salmon that spawn in Stuart Lake and other lakes nearby, have the longest migration of any salmon popula- tion in BC – 1,200 km. As is probably the case with many species in a complex system, more than one factor is affecting their success. Records show that migration time has shifted about 8 days, most likely due to warmer sea surface temper tures (Macdonald, J.S., Williams, I.V. and Woodey, J.C. 2000. The effects of in-river conditions on migrating sockeye salmon (Oncorhynchus nerka). In J.S. Macdonald (ed.) Mortality during the migration of Fraser River sockeye salmon (Oncorhynchus nerka): a study of the effect of ocean and river environmental conditions in 1997. Can. Tech. Rep. Fish. Aguat. Sci. 2315. pp. 39-57.) This brings the salmon to the Fraser earlier when the seasonal maximum river flow is occur- ring. By the time the flow recedes, the river water temper- ature can rise to stressful levels.
An example of species changes in the marine realm comes from monitoring macroalgae (kelp). Dictyoneuropsis reticulate, a species common in California in the Goslings study area in BC. Due to monitoring of the marine systems by Jane Watson, this kelp was first reported in 1994. In 2007 it had became the most abundant kelp. A second kelp, Eisenia arborea also considered a more southern species was absent in 1991; and by 2007 made up approximately 20% of stalked kelps in the same area.
The largest colony of Cassin’s Auklet in the world (1.1 million birds) is located on Triangle Island, an ecological reserve at the north end of Vancouver Island. Researchers from Simon Fraser University noticed that the population declined dramatically during the 1990s. They discovered that this was due to the uncoupling of timing between the chick’s need for food and the availability of copepods (main food). The copepods require cool waters and when sea surface temperatures become too warm, they descend to deeper cooler water and are out of reach of Cassin Auklet parents. Lack of food for chicks caused starvation and therefore the population declined.
What to Expect for Species and Ecosystems in the Future?
Looking at fossil records may provide clues as to what our world may resemble if we warm  significantly because it was 2-3 degrees higher 6-10,000 years ago. During this warmer period, grassland and steppes were more extensive, bogs less common, there were no modern forests equivalents, fires were more common, tree lines higher, and there were fewer small lakes.
trajectory than what we can expect. Modeling can help indicate what to expect from here forward. Recent work by Bunnell et al. (Bunnell, Fred, Ralph Wells, and Arnold Moy. 2010. Vulnerability of wetlands to climate change in the Southern Interior Ecoprovince: a preliminary assessment. BC Forest Sciences Program Y102120, Ducks Unlimited Canada and Environment Canada), assessed relative vulnerability to climate change for about 35,000 ha of wetlands in the Southern Interior Ecoprovince. These researchers used an index of the risk of drying based on snowpack and the summer heat moisture index. Over all, their conclusion is that there will be a decline in interior wetlands. Their report states:
“… the smallest wetlands are the most vulnerable and these comprise 67.7% of current wetlands. At least two species at risk, Great Basin Spadefoot and Tiger Salamander, exploit small, shallow wetlands. More broadly, about 80 bird species rely on wetlands as their pri- mary breeding habitat. The simple projection employed permits refinements that would be useful in guiding conserva- tion efforts.”
It is expected that grasslands and dry forests will expand in the interior and temperate rainforests on the coast and interior will expand upslope. This will squeeze the subalpine forests and the alpine ecosystems up and possibly off the tops of the moun- tains. Expansion of temperate rainforest and boreal forests upslope will also mean a loss of subalpine forests and a decline of alpine ecosystems. Loss of gla- ciers affects changes to stream flow patterns, temperature and ground water. There will be a reduction of coastal wetlands and in the lower mainland, coastal wetlands will be squeezed between dykes and rising seas.
These few examples do not tell the whole story of species response to a changing climate. We have to remember that each of these organisms interacts with others. It is the sum of these interactions that make up ecosys- tems. When the salmon don’t make it to Stuart Lake what are the cascading effects? Speciesare only part of the story as other interactions are affected. As ecosystem functions are dis- rupted, ecosystems shift and reconfigure and structures are altered, so will the species assemblages be rejigged.
Climate change is certain but the specific species and ecosystem responses are unknown. Regional variation, new evolu- tionary pressures and the appearance of ecosystems with no contemporary analogues are to be expected. Declines in species (even crashes) do not necessarily lead to extinction. There could be gradual or sudden expansion or decline of species or ecosystems might cross some threshold as a result of an extreme event.
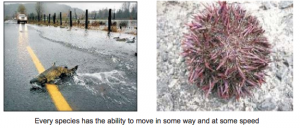 The fossil record shows that some species migrated much faster than predicted. It is difficult to predict the speed of ongoing adaptive evolution that will occur in response to changes. Species responses can be direct such as changes in flowering time, breeding time, and migration patterns or indirect, such as changes to food resources or competition. There are many more possibilities because of complex interactions – most of which we do not know or understand.
Our Protected Area System a Review
The Protected Areas System makesup14% of the area of BC. The objectives of the system are conservation and recreation. The Protected Areas System is the cornerstone of biodiversity conservation in the province.
In this presentation so far, I have provided indicators of the magnitude of the changes that we are already experiencing using a few examples supported by monitoring data. What are we expecting and how can our static protected areas system play its role as the cornerstone of biodiversity conservation for the province?
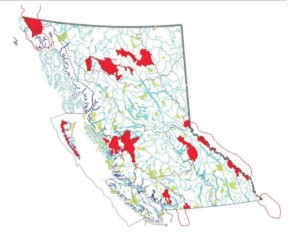 The system currently includes about 13,000,000 ha in the provincial system, 600,000 ha in the federal system and 250,000 ha in other conservation lands and also regional parks and municipal parks.
To understand the system requires a brief history review. The first several parks were large and iconic. Some were at the end of new rail lines to encourage rail travel. Bc’s first park, Strathcona Park, was linked to the rail-based recreation and wasestablished in1911. We are coming up on a 100th birthday celebration of the BC Parks system.
As the park system reached middle age in the post-war era, there was a demand for a system of parks along highways that could meet the needs of people looking for recreation, day use areas and car camping.
In 1987, Gro Brundtland wrote a report for the international community called Our Common Future. In the report she sets a goal of 12% for protection of the land across the globe. This was not a goal based on science. It was a number that was considered way out there com- pared to where most countries currently were, and it was some- thing to strive for. BC took its place at the front of the world stage and passed legislation that set 12% as the protected area target for 2000. According to the conservation tenets of the day, some forward thinking people in government took the opportunity to create guidance that would help us develop a system that represented all the ecological variation in the province. This was called the Protected Areas Strategy(PAS). The conservation goals in the system were to achieve representation across the breadth of the province and the policy was not affected by knowledge of climate change.
The basis of the representation strategy were two classification systems. One system, the Ecoregional Classification System, is hierarchical and based on broad similarities in geogra- phy and climate. In the province there are three levels that are commonly used: 1)ecoprovinces, 2) ecoregions and 3)ecosections. The PAS focuses on ecosections. There are about 130 ecosections. The Ecoregional Classification System tends to push represen- tation to all corners of the prov- ince. The other system is the Biogeoclimatic Ecosystem Classification (BEC) system. It is also hierarchical and based on moisture and temperature. The hierarchy goes from zone to subzone, to subzone variant and finally site series. The PAS aims to represent each variant in the province. There are 218 variants. The BEC system tends to push representation to all elevations.
The guidance provided when planning park expansion, resulted in the levels of representation in the PAS we have today. We did not achieve equal representation with BEC in every zone. Three zones are clearly under-represented and these are the BEC zones with the highest conservation con- cern (M. Austin et al. (ed.) 2008. Taking Nature’s Pulse. Biodiversity BC.). These zones are the Coastal Douglas Fir Zone (CDF). Interior Douglas Fir Zone (IDF) and Ponderosa Pine zone (PP) which all have < 5 percent representation. The Bunchgrass zone (BG) is also underrepresented at 10 per- cent.
Predicted Changes in BEC Zones 1980 – 2080
 The BEC system is moving with climate change. The cur- rent BEC classification was initially developed in the late 20th century. Using climate models, it is possible to forecast where the climate envelopes will migrate. Note that this does not mean that the ecosystems we understand today will follow the climate envelope. Ecosystems are based on much more than climate. The Peace area, in this model, is predicted to be appro- priate for Ponderosa Pine. Will the area be covered by Ponderosa Pine and all the ecosystem components that are anticipated by that ecosystem? This is doubtful but it does give an indication of how fluid the underlying ecosystems can be. Since ecosystems will always reflect topographic and latitudinal variability, the current protected areas system will con- tinue to be representative of the underlying ecosystems no matter how they move around and refigure. Refiguring takes place at the species, level so it is hard to predict which species will move and on what schedule. In the future, with the current protected areas design, we get a similar variability of representa- tion, but the zones that are over- represented and those that are under-represented may change.
According to the climate envelope model, the future potential area for Coastal Douglas-fir BEC zone will be increasing by a factor of about six. Using the same protected area boundaries that gave us less than 2 percent of representation currently, we will have over 10 percent in the future. Using representation as a guideline, the CDF is one of the winners.
The Alpine Tundra (AT) is currently one of our most extensive zones, but also one that is over-represented at over 20 percent. This zone is anticipated to be significantly reduced over the course of this century going from 135,000 sq. km to around 3,000. In spite of that reduction, the protected areas system is posi- tioned to continue to over- represent AT in the future. It will be a much smaller component of the system, but a large percentage of the total alpine in the province. There is evidence that small trees are getting a foothold in a moun- tain pass where persistent snow has kept areas treeless for centu- ries.
So now we are sitting on a protected area system that is relatively well represented and likely to remain so into the future in spite of the movement of ecosystems. If we can assume that we have representation, are we ok?this is a challenge when climate is changing slowly as we were used to, or quickly as we are getting used to – the biggest challenge is maintaining the ability of species to move and evolve with the changing climate.
The Path Forward
This next section will con- sider the role of the PA system in the provincial context and the ability of species to move. This can be thought of as a review of representation and a shift towards a landscape strategy to enhance species ability to adapt and move in a changing climate. Then there is the adaptation to climate change in park manage- ment. The approaches can be thought of as: 1) looking outside our protected areas boundaries; and 2) looking inside the pro- tected areas.
Looking Outside Our Protected Area Boundaries
First the big picture and how the protected area system can serve the province in its efforts to conserve biodiversity. Park agencies across the globe have been struggling with the shift from focussing on representa- tion as a way to ensure the survival of species and ecosys- tems, to recognizing that the constantly shifting nature of the natural world makes a bigger landscape view of paramount importance.
Adaptive Capacity
The most important thing we have to do is to maintain the ability of the natural world to choose its own path to cope with climate change – to evolve genetically, behaviourally and inspace. This has been called maintaining adaptive capacity. There are two basic parts of adaptive capacity. The first is genetic diversity. The more genes in the gene pool, the more possible solutions are available along an evolutionary pathway. The second is the ability of species to move. If they can, organisms will adjust their location to optimize outcomes. Every species has the ability to move in some way and at some speed.
We have a good start with large parks and complexes that are at least 270,000 ha. That sizes based on science and comes from a publication in Conservation Biology by Brent Gurds, Tom Nudds and Don Rivard (2001). As early as the 1980s, William Newmark noted that smaller parks were losing species.
This map includes areas that are adjacent to protected areas in other jurisdictions that bring the entire complex to an area over 270,000. These are indicated by the red lines (not accurate…hand drawn. These 11 areas represent more than 2/3 of our system.
A quote from E.O. Wilson in his book The Creation, 2006 states the importance of natural areas.
There is no solution avail- able, I assure you, to save Earth’s biodiversity other than the preservation of natural environments in reserves large enough to maintain wild populations sustainably. Only nature can serve as the planetary ark.
Landscape Strategies need to protect large areas and contain well represented areas geo- graphically, with the full range of elevation, aspect, and include whole watersheds. A landscape strategy also needs to identify and protect refugia such as north aspects, toe slopes, complex
The biggest challenge – and topographies, terrestrial habitats and streams associated with large glaciers and ice fields and areas that acted as refuges during past climate change.
Other elements of a landscape strategy are to augment the connectivity that is inherent in the large complexes by identify- ing continent scale corridors. Choose some indicator species to monitor actual changes against predicted changes so that it is possible to calibrate our expectations. Choosing species for monitoring means monitor- ing some that are predicted to change slowly or not at all and others that are predicted to change rapidly or be extirpated (e.g. pika).
In BC we have a great start with the current protected areas system as an anchor for a larger landscape strategy. We need to do some work to identify refugia and a monitoring system that helps calibrate our expectations would be useful for managers. Australia has just announced the Trans Australia Eco-Link which is a swath of land 3,500 km long covering 1.4 million sq. km. It is anchored by their protected areas, but includes other public land and private land.
Jim Pojar has recently released a report called “A New Climate for Conservation” in which he advocates 50 percent of the landbase dedicated to conservation. He is not suggesting that it is all protected land, but it should be managed to be wild enough to allow all kinds of organisms to move through and inhabit it.
One of the projects we are currently engaged in is a very high level of landscape analysis that could be used to identify opportunities and vulnerabilities at this broad scale. This assess- ment shows two important things about each third order watershed – the current level of disturbance and the vulnerability to future disturbance. The colour scheme that results from this analysis points out places where there are opportunities to protect and places where resto- ration is necessary. So far we have 5 areas (ecoregions) mapped. Ultimately we would like to have every ecoregion in the province completed. For now we are using the five areas that are completed to promote the usefulness of this level of mapping.
Looking Inside the PAS
How is BC Parks managing within our boundaries to make a difference? In the last couple of months, the province has released a climate change adaptation strategy, so I can fitwhat we are doing into these general categories.
Provincial Climate Change Adaptation Strategy set out three goals:
1. Build a Strong Foundation of Knowledge;
2. Make Adaptation Part of Government’s Business; and
3. Assess Risks and Implement
Priority Adaptation Actions. As part of the first goal, BC Parks is partnering with UNBC to create a long-term monitor- ing plan that can be carried out across a region using existing staff and/or community groups. BC Parks will also continue to update and maintain a database on conservation values and
threats in each protected area. As part of the second goal of the adaptation strategy, BC Parks is reviewing the Conservation Program Plan Policies and the Impact Assessment Procedure to bring climate change consid- erations into the purview of decision makers. A review and update of the Ecological Reserve Guide with a new section on climate change is also underway. Success can be measured by how much climate change and consideration of future condi- tions becomes part of the culture of decision making at all levels. As part of the third goal BC Parks has done some provincial- wide analyses to help planners and managers understand the risks of climate change. Two of these are the identification of glacially dominated watersheds and a sensitivity analysis of marine shorelines and sea level rise.We know that sea level rise will not affect all shorelines equally. Currently Parks staff are working on a guide for park planners in coastal regions to help them make decisions about how to guide management in coastal areas. As a background for that guide, parks staff are working with an advanced GIS student from University of Victoria to provide a classification of the shoreline from both the marine side and the shore side. Estuaries such as Goldstream Park will be affected very differently than steep sloped parks with rocky shores like Gowlland Tod.
Climate change is going to change the face of the province as we know it. But organisms have proven to be remarkably adaptable. Biodiversity will not disappear, but stands a good chance of being diminished. Our job is to do everything wecan to maintain adaptive capacity so the most diverse province can continue to be just that.
